This Web page describes how the GUI can be used to navigate through the results of a query.
The Create Simple Table demo has been used extensively on this web site. It creates a table with 5 rows. The result of running the query Select * from family are shown in the following screenshot.
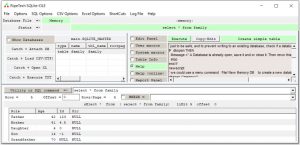
If the number of rows returned by the query exceeds the display area in the lower panel, then scrollbars will be displayed.
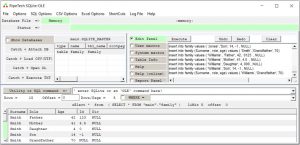
The following script extends the demo by one column, and 10 rows.
' just to be safe, and to prevent writing to an existing database, check if a database is openIF dbopen THENMessage =" A Database is already open, save it and or close it. Then rerun this demo"stopend ifnewscript ' we could use a menu command File/ New Memory DB to create a new database in memory, we will use a commanddbopen ("memory")' the following are pure SQLite commands' create a table called Family with 4 columns' refer to the demo via menu Help / SQL / Demos / BLOBs on using the column named Piccreate table family ( Surname text, Role text , Age int, Id TEXT , Pic BLOB )insert into family values ( 'Smith' , 'Father', 42, 0123 , NULL)insert into family values ( 'Smith' ,'Mother', 41, 4.5 , NULL)insert into family values ( 'Smith' ,'Daughter', 4, 000 , NULL)insert into family values ( 'Smith' ,'Son', 14, -1 , NULL)insert into family (Surname , role, age) values ( 'Smith' ,'Grandfather', 70)insert into family values ( 'Jones' , 'Father', 42, 0123 , NULL)insert into family values ( 'Jones' ,'Mother', 41, 4.5 , NULL)insert into family values ( 'Jones' ,'Daughter', 4, 000 , NULL)insert into family values ( 'Jones' ,'Son', 14, -1 , NULL)insert into family (Surname , role, age) values ( 'Smith' ,'Grandfather', 70)insert into family values ( 'Williams' , 'Father', 42, 0123 , NULL)insert into family values ( 'Williams' ,'Mother', 41, 4.5 , NULL)insert into family values ( 'Williams' ,'Daughter', 4, 000 , NULL)insert into family values ( 'Williams' ,'Son', 14, -1 , NULL)insert into family (Surname , role, age) values ( 'Williams' ,'Grandfather', 70)
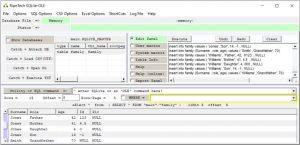
When I run the script, without changing the size of the GUI’s display area I get:
We should note the 4 fields outlined in red, blue, green and brown in the following screenshot.
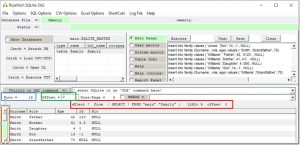
- The number of rows returned by the query is shown in the blue box.
- The row number (zero based) of the top row of the display is shown in the green box.
- The actual query that was run (in order to create the display) is shown in the red box.
- The brown box shows the vertical scroll bar with which we can scroll to other rows in the query results ( 15 rows: 0..14). The colour of the scroll bar has the following meaning:
- green – we are at the top
- bluish-mauve – we are not at the top or the bottom
- redish – we are at the end
Click on the scroll bar in the green area to move to the next display page.
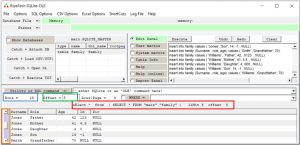
- blue box – unchanged, the query has not changed
- green box – has moved on 5 rows
- red box – has changed to select from offset 5
- brown box – has changed colour to show that we are not at the top or the bottom.
Tips and tricks:
Trick to save you typing:
You can use the mouse to extract information from the query results Listview panel:
- Double left mouse click on any cell, and the cell header (the column name) will be written to the Where field.
- Double right mouse click on any cell, and the cell contents will be written to the Where field.
The Where field is outlined in the following screenshot in yellow.
Trick to show a summary of a query result’s values in a given column
A Left mouse click on a column name triggers the standard sort function of a Listview column.
But a right mouse click will display a summary of the content in that column of the query result. So right mouse click on the column header for Surname
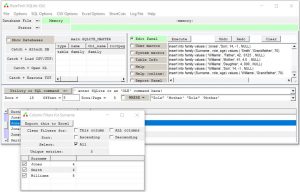
The result of a right mouse click is the appearance of a pop-up window, listing all of the values in that column of the query result and how often that value occurs. The pop-up includes a few options so that we can:
- send the popup-window’s Listview data to Excel (the function xlFormatTable can be used on the result).
- Remove (temporarily) values from the displayable results
- Force the display to be alphabetically or reverse alphabetically sorted, or as originally defined.
If any form of sorting or filtering is made active, then that column’s header will be changed to yellow to indicate that the column is not displayed in its default state.